|
"Happy New Year to all our readers! We've kicked off 2024 diving right back into investing using our AI System. Over the past 11 years, we've meticulously developed this system, and I'm thrilled to share that it's performing exceptionally well. Today, on the very first day of 2024, our system precisely pinpointed the stocks to buy. Currently, our portfolio holds three purchases, all showing positive gains despite the challenging market conditions. Our best trade has already yielded over 8% profit in less than a day! Our system is designed around compounding profits with smaller initial investments, allowing substantial gains. Consider this example: Starting with $50,000, investing $30,000 today resulted in gains of $850, $250, and $400 respectively on three separate investments, totaling a profit of $1,250! That's over 2.5% profit in a single day. If this trend continues for 100 days, it would accumulate a whopping 250% profit! If you're seeking to make money through investing right now, it requires diligence. However, the potential rewards are immense! Don't rely solely on news reports, as the information often gets factored into stock prices well in advance. The real key lies in the charts! Our SST-AI system meticulously analyzes these charts, providing us with signals for opportune moments to buy stocks. Remember, successful investing demands hard work, but the payoff can be extraordinary. Trust in the data, rely on strategic analysis, and don't solely depend on news sources for your investment decisions. Stay tuned for more insights from our AI-driven approach to the market!" 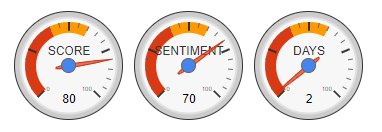 "Technical Analysis Image of Technical Analysis of stock $LTHM on 12/9/2023 Technical Analysis of stock $LTHM on 12/9/2023 Based on the technical analysis, I rate the stock $LTHM 7/10 for the short term on 12/9/2023. The stock has been on an upward trend since early December and recently broke a significant resistance level around $14.00. This is a positive signal, indicating a likely further rise in the stock price. Growth Potential Image of Growth Potential of stock $LTHM on 12/9/2023 Growth Potential of stock $LTHM on 12/9/2023 Based on the growth potential, I rate the stock $LTHM 8/10 for the short term on 12/9/2023. Livent is a producer of lithium, a crucial component for electric vehicle battery production. The demand for lithium is rapidly increasing, potentially driving Livent's growth. Overall Score Considering the technical analysis and growth potential, I give the stock $LTHM an overall score of 7.5/10 for the short term on 12/9/2023. This indicates a strong potential for short-term value appreciation. Recommendation Based on the overall score, I recommend buying the stock $LTHM. The stock is likely undervalued, and there's significant growth potential. Risks Naturally, there are risks associated with the stock. The lithium market is volatile, leading to potential fluctuations in the stock price. Additionally, it's essential to note that Livent faces competition from companies like Albemarle and SQM. Conclusion Ultimately, the decision to buy or sell a stock is a personal one. Conduct your own research and consider your risk tolerance before making any decisions."  Working with an AI trading system has been an incredibly rewarding experience. It's truly fascinating to witness how the system adapts to the volatile nature of the stock market in such a short span of time. This Monday, we celebrated another impressive profit with a few well-executed trades. This achievement is particularly noteworthy given the market's restlessness just last week. The real beauty of this AI trading system lies in its ability to eliminate the emotional uncertainties that typically accompany such periods. It has become a reliable partner in navigating the fluctuations and uncertainties of the stock market. Each day brings a sense of excitement as I eagerly anticipate the opportunity to collaborate with the AI trading system once again. One of the most remarkable aspects is its simplicity, which doesn't compromise its profitability. In fact, our gains have been substantial, and the ease with which the system operates is truly remarkable. Moreover, the cost-effectiveness of this solution is undeniable in our case, making it an even more attractive proposition. In summary, this AI trading system has transformed the way I approach the stock market. It has empowered me to overcome emotional insecurities during turbulent periods, providing consistent profitability and newfound confidence. I can confidently recommend this system to anyone looking to enhance their trading experience. Here's to more prosperous days ahead with our trusty AI trading companion!  Introduction: Greetings, fellow investors, both seasoned and new! Today, I'd like to share some insights into the world of investing, particularly the two major approaches that guide our decision-making process: fundamental analysis and technical analysis. As a seasoned investor with years of experience, I've witnessed the evolution of these strategies and their impact on the market. Let's delve into the fascinating realm of technical analysis and its historical origins. The Advent of Technical Analysis: In the ever-evolving landscape of investing, one approach that has stood the test of time is technical analysis. This art has undergone significant refinement over the years, with roots tracing back to legendary figures like Jesse Livermore, a trading luminary from the late 1800s to the early 1900s. Livermore's uncanny ability to anticipate stock price movements by closely observing the ticker tape marked the early stages of what we now call technical analysis. By keenly analyzing the characteristics of the ticker tape, Livermore discerned patterns that hinted at future price movements. Essentially, he was tapping into the collective mindset of the market, extracting insights from the composite opinions of all those involved in stocks. This practice, known as "tape reading," eventually evolved with the introduction of charts, and further progressed through the advent of computers and the internet. Today, technical analysis has transformed into a rich repository of knowledge encompassing the study and interpretation of charts. This approach enables us to decipher potential future directions of stocks and commodities based on historical price patterns. The Fundamental Debate: In the world of investing, we encounter two primary schools of thought: fundamental analysis and technical analysis. Fundamental analysis centers around understanding the intrinsic value of a stock or commodity by studying the underlying companies, their financials, and the economic conditions they represent. On the other hand, technical analysis focuses on predicting price movements through chart patterns. Enthusiasts of both fundamental and technical analysis tend to champion their chosen method. Some proponents of fundamental analysis dismiss technical analysis as mere "chart junkies," akin to fortune tellers or tea leaf readers. Fundamentalists assert their superiority, citing the belief that a stock's value is ultimately driven by tangible financial and economic factors. For instance, if a company exhibits robust growth, this growth should eventually be mirrored in its stock price, causing it to rise. However, a significant hurdle accompanies fundamental analysis: The Knowledge Conundrum: No matter how much time you invest in fundamental analysis, there's an inescapable truth: Any information you uncover about a company is likely known to a multitude of others. Countless individuals, research firms, and financial institutions tirelessly scrutinize every facet of the market day in and day out. They dissect companies, interview executives, and absorb information at an astounding rate. In this hyper-connected age, your research is unlikely to yield insights that are not already widely acknowledged – at least not legally. The competitive nature of the market means that stock prices already incorporate the knowledge garnered by these extensive efforts. In essence, the research conducted by these entities has already been "priced in," leaving you without a distinctive edge. Conclusion: As a new investor, understanding the dichotomy between fundamental and technical analysis is crucial. While fundamental analysis delves into the core aspects of a company's value, technical analysis draws from historical price patterns to anticipate future movements. Recognizing the limitations of fundamental analysis – the challenge of finding unique insights amid a sea of existing information – empowers us to explore alternative strategies like technical analysis. Ultimately, a holistic approach that integrates elements of both fundamental and technical analysis can yield a more comprehensive understanding of the complex and dynamic world of investing. Embrace these insights, and embark on your investment journey with an open mind and a willingness to adapt in this ever-evolving landscape. Happy investing! Hey there, fellow traders and investors! We've got some exciting news to share! At the request of our valued customers, we've revamped our rating system, making it even more versatile and beneficial for all of you. Now, not just one, but two ratings are available for each share. The first rating, the "Score," represents the short-term outlook, helping day traders make informed decisions and seize those quick opportunities in the market. The second rating, on the other hand, reflects the sentiment for a longer swing trade, catering to swing traders with varying time frames (short, and medium-term). This enhancement in our tools means that a broader group of investors can now benefit from our platform. Whether you're a day trader looking for fast-paced action or a swing trader planning for those more extended market moves, we've got you covered. And the best part? Our services remain incredibly affordable, making it accessible to everyone! For just $16.95 per month, you can take advantage of our upgraded ratings and optimize your trading strategies like never before. So, what are you waiting for? Join our community today and gain an edge in the ever-changing world of finance. Let's make those profits together! Happy trading, 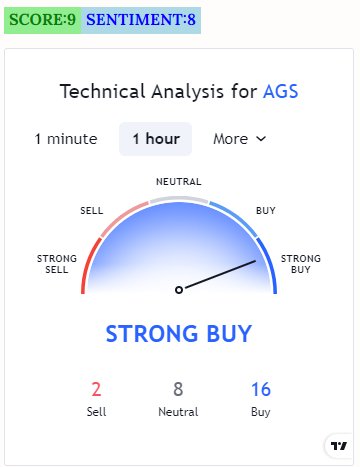  Once upon a time, in the fast-paced world of investing, there was a top-notch investor known for their keen market sense and impressive returns. This week, they found themselves bombarded with questions from eager individuals, all asking the same thing: "When is the right time to sell your stocks?" But alas, there was no simple answer, for each investor had unique goals and aspirations. For those who embraced day trading or swing trading, one golden rule stood out: never let a handsome profit slip away. After all, a juicy gain today could vanish into thin air the very next day! And that would be such a shame. Our savvy investor knew that maximizing profits meant consistently making the most of every opportunity, and they were eager to share their wisdom. Imagine starting with a sum of $10,000. If one could generate a 3% profit on this amount twice a week, the weekly earnings would amount to $600! And that's just the beginning. Carrying on with the same success for a full month would lead to a whopping $2400! A remarkable 24% return on the initial investment! Such gains would bring immense joy to any investor fortunate enough to achieve them. Our wise investor knew that it wasn't just about luck; it was about dedication, strategy, and knowing when to seize the right moments. While they relished the thrill of turning a profit, they also knew that risks lurked around every corner. Caution and discipline were their trusted allies in this tumultuous journey. As the months passed, our investor's reputation spread far and wide, attracting aspiring traders eager to learn from the best. They emphasized the importance of setting clear objectives and understanding the individual tolerance for risk. "Stay informed, remain agile, and never let emotions guide your decisions," they advised. With each success and every calculated move, their confidence grew, but so did their humility. They recognized that even the best investors face occasional setbacks. However, they knew that staying focused on long-term gains, while not being afraid to take well-calculated short-term profits, was the key to their prosperity. As the years went by, our top traders continued to inspire others with their remarkable journey and achievements. Their success story became a guiding light for many, teaching countless individuals how to navigate the tempestuous seas of the stock market with finesse. And so, the tale of our illustrious investor reminds us that the path to financial success is paved with knowledge, perseverance, and an unwavering commitment to one's goals. Whether you're a seasoned professional or a beginner taking your first steps, the journey of a top investor begins with the courage to learn and the determination to excel. When to Sell It’s one thing to bail on a position to avoid deepening losses, it is another thing to sell for profit. This is the age-old question: When do you exit a position? How much gain is “enough?” What if you sell and the stock soars? What if you don’t sell and the stock collapses? These questions tend to be more difficult than stop losses, mainly because there are no perfect answers. I tried many different systems over the years: Trailing stops, limited percentage gains (e.g., “Sell when I exceed 2%”), fixed time periods (“sell after two days” or “always sell at close”). Each of these methods has merit, but they each have a downside as well. The trailing stop, for instance, appears attractive on the surface, until you start discovering that your position is taken out on small, momentary blips. Suppose you set a trailing stop at 1% (if the stock falls more than 1% from its high, the position is closed). In theory, this makes sense, because you will keep holding the position as long as the stock keeps climbing higher. The problem is that a stock can have a momentary “air pocket” and fall below your stop, even for a few seconds. You get taken out, only to have the stock resume its march higher. If you try to counter this with a larger (wider) stop, you throw away too much gain. There is some merit to the limited gain method, which I have done often. This is where you decide on a reasonable gain, then set a sell-limit order for that price. If the stock trips the order, you’re out, and with a gain. This can work well overall, but the downside is that you can miss out on some spectacular gains if you sell too soon. There is even a case for a time-limited system, e.g., having a fixed time horizon. The idea is that nothing can go up in a straight line, so if you are showing profits after, say, 3 days, it is mathematically improbable that the gains will continue. The downside to this method is that some stocks do continue, and you could be throwing away the better part of the gain. Considering the various methods available, which one is best? The method I like the most (not mentioned above) is the simplest one, albeit unscientific: Take gains the moment you are happy with them. Of all the methods I have tried, “take profits when you are happy with the gains” is the one I keep going back to. What does “happy with the gains” mean? It means you look at your position, and its gain, and you think, “Wow, that’s nice.” Or, “Ah, nice trade.” Take the gains and don’t look back. I am not sure why this method is so workable, but it could very well be psychological and nothing else. Wins produce good spirits, and good spirits are a key ingredient to success, otherwise you will be playing scared, and this will cause you to sell too soon or hold on to losses to long. There is also something about Murphy’s Law that will slam you with a loss the moment you are “excited” about the results. Either way, I have never found a better method than this. Combinations Although my favorite method is to take gains the moment I am “happy” with them, I often like to combine that with a couple of other methods. I will often decide up front what kind of gains I would be happy about, then I set a sell-limit order slightly above that. More often than not, the trade hits that sell-limit and it exits automatically. I also like to combine the “happy-with” method with a trailing stop. The moment I am happy with a position, instead of outright selling, I will set a hard stop slightly below the current price. If I get stopped out, I am fine---and still happy. If the stock powers forward, I raise the stop. In this way, I often eek out a little more gain than the “happy-with” level. One other combination I have used from time to time is the “half position” strategy. When I reach the “happy-with” level, I sell half the position, then set a trailing stop for the second half. Impressive Gains with Our AI System – Maximizing Profits Even in Challenging Times
I am delighted to share some exciting news with you this week. Our AI system has once again proven its worth, delivering remarkable returns of over 10% across multiple stocks. This achievement reaffirms the incredible value of our AI-driven investment approach, particularly in mitigating losses during unfavorable market conditions. The ability to minimize losses during challenging times has positioned us to take significant strides towards generating substantial profits once again. As I have mentioned before, it is the accumulation of numerous small wins that culminate in exceptional annual returns. Our AI system continues to leverage cutting-edge technology and sophisticated algorithms to analyze vast amounts of data, enabling us to identify lucrative investment opportunities. By utilizing this advanced system, we stay one step ahead of market trends and make informed investment decisions that yield exceptional results. In addition to the substantial gains we have witnessed, it's important to acknowledge the long-term benefits of employing our AI system. By consistently outperforming traditional investment strategies, we are confident that our approach will continue to deliver sustainable growth and ultimately enhance your investment portfolio. We remain committed to providing you with the best possible investment experience and leveraging the power of artificial intelligence to achieve outstanding returns. Our team of experts is continuously refining and optimizing our AI algorithms, ensuring that we capitalize on every available opportunity. As always, we urge you to consider the principles of diversification and risk management when investing. While our AI system significantly minimizes losses, it is crucial to maintain a balanced and diversified portfolio to navigate any unforeseen market fluctuations effectively. We are thrilled about the positive trajectory we are on and are grateful for your continued trust and support. Together, we will continue to seize opportunities, adapt to market dynamics, and maximize our profits. If you have any questions or require further information, please do not hesitate to reach out to our dedicated team. Wishing you continued success and prosperity. Sincerely, |
BlogAdvisory service that offers real-time and end of the day trading ideas. 
Archives
April 2024
Categories |
 RSS Feed